Figures
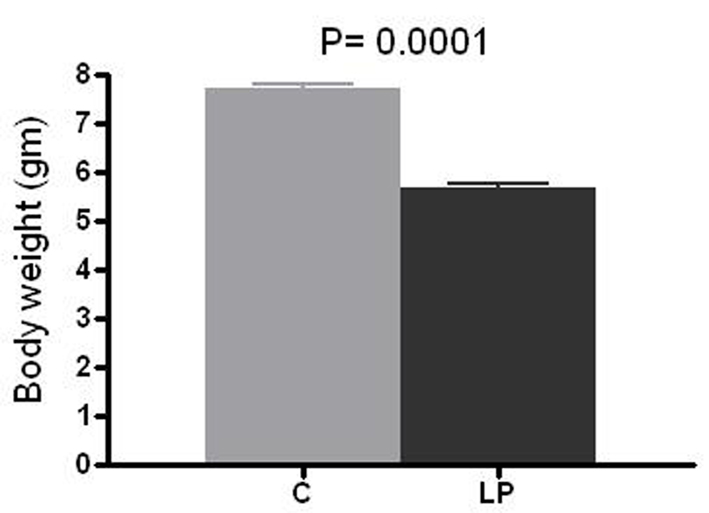
Figure 1. Birth weight. Body weight was measured at day 1-2 of life in prenatally control (C) and low protein (LP) diet animals. Data presented as mean ± SEM (n = 11-12 in each group).
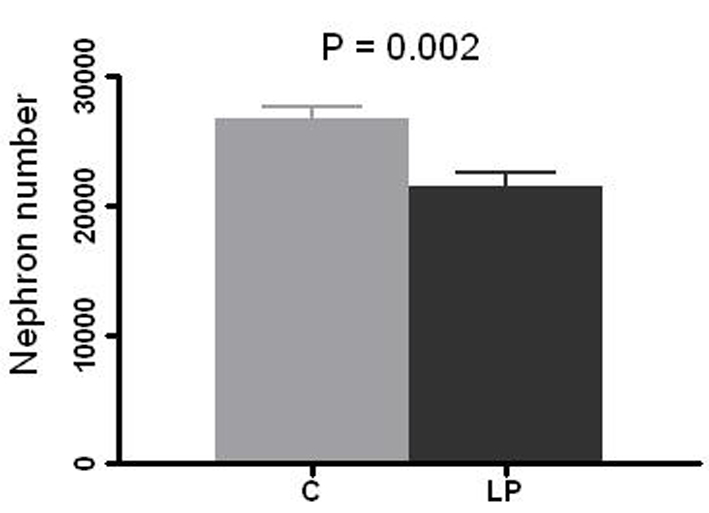
Figure 2. Nephron number per kidney. Right kidney in prenatally control (C) and low protein (LP) diet rats was resected at 4 - 5 weeks of age and glomeruli count was performed by the maceration method. Data presented as mean ± SEM (n = 10 in each group).
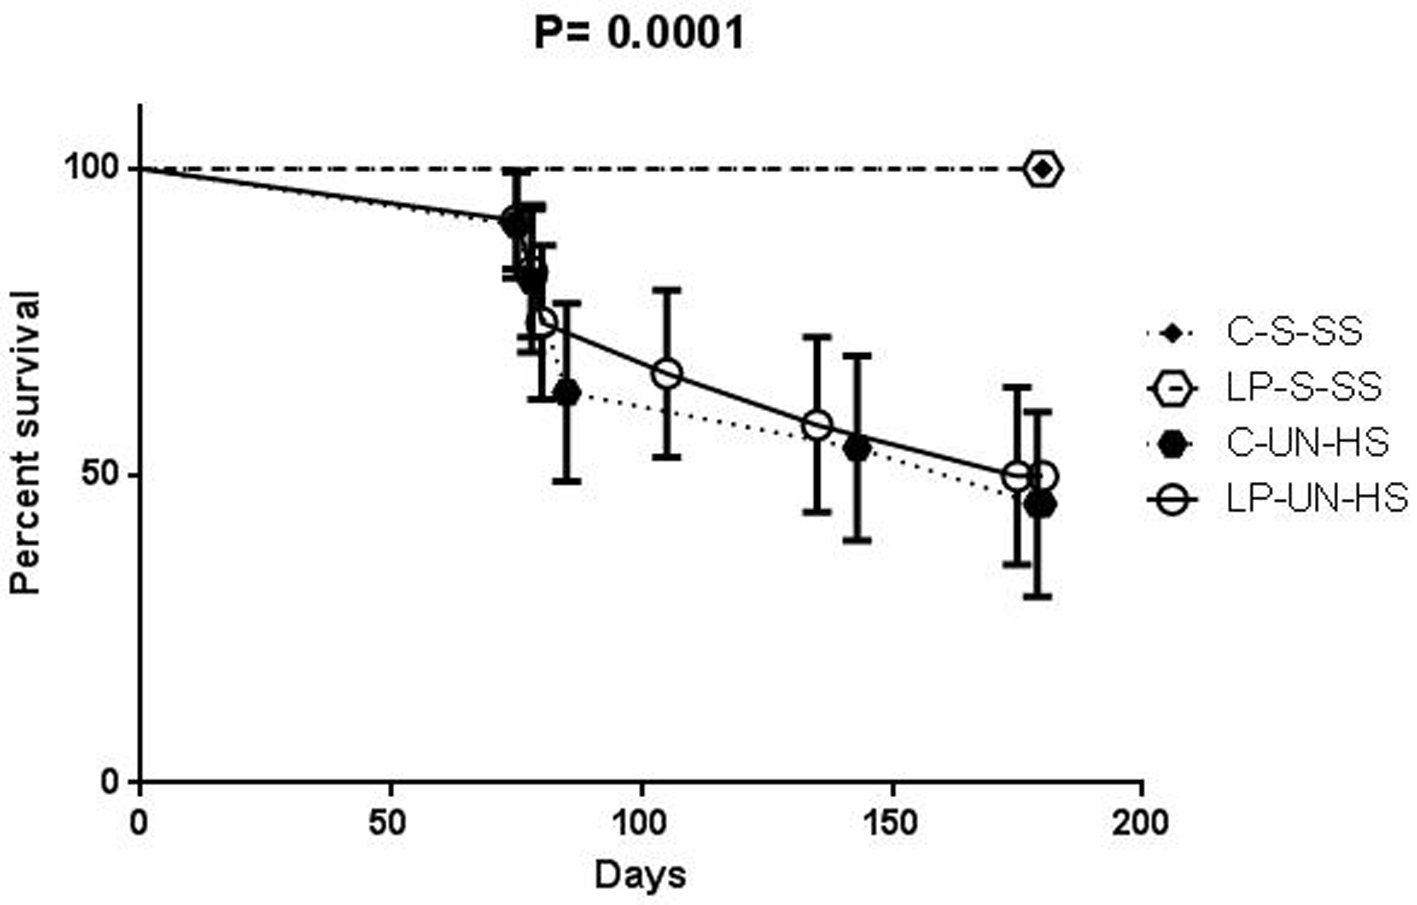
Figure 3. Survival curve. Survival in animals of the four groups over the 6 months of follow-up. C: prenatal control diet; LP: prenatal low protein diet; S: sham surgery; UN: uninephrectomy; SS: standard salt diet postnatally; HS: high salt diet on day 21-60 of life (n = 11-12 in each group, analysis was performed by Fisher’s test).
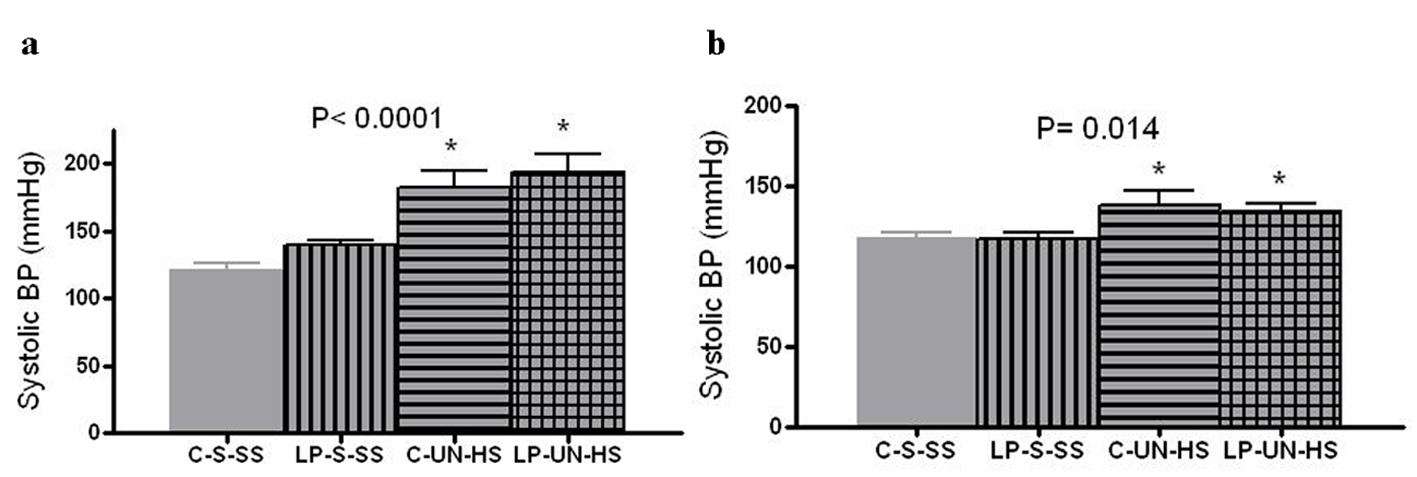
Figure 4. Systolic blood pressure. Tail cuff blood pressure at (a) 2 months (n = 10-12 in each group) and in (b) 6 months old females (n = 5-7 in each group). C: prenatal control diet; LP: prenatal low protein diet; S: sham surgery; UN: uninephrectomy; SS: standard salt diet postnatally; HS: high salt diet on day 21-60 of life (*P < 0.05 vs. C-S-SS).
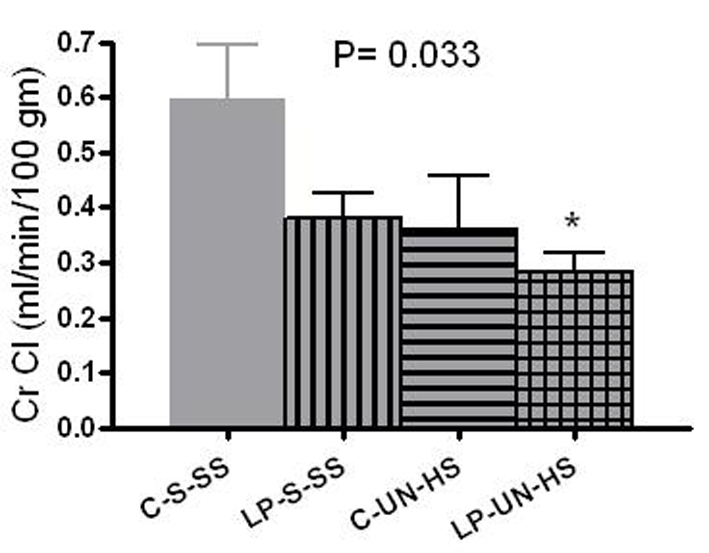
Figure 5. Renal function. Renal function was measured by creatinine clearance (CrCl) in 6 month old females (mL/min/100 g of body weight). C: prenatal control diet; LP: prenatal low protein diet; S: sham surgery; UN: uninephrectomy; SS: standard salt diet postnatally; HS: high salt diet on day 21-60 of life (n = 5-7 in each group,*P < 0.05 vs. C-S-SS).
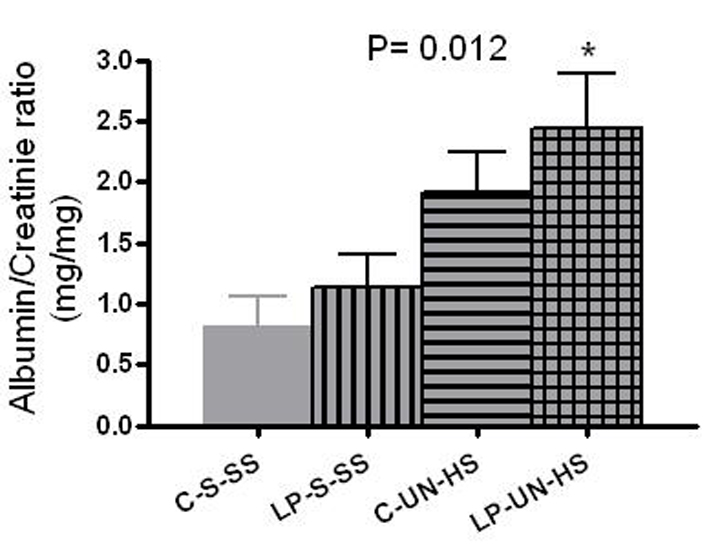
Figure 6. Albumin excresion. Albumin excretion in 6 months old females, measured as albumin/creatinine ratio (mg/mg). C: prenatal control diet; LP: prenatal low protein diet; S: sham surgery; UN: uninephrectomy; SS: standard salt diet postnatally; HS: high salt diet on day 21-60 of life (n = 5-7 in each group, *P < 0.05 vs. C-S-SS).
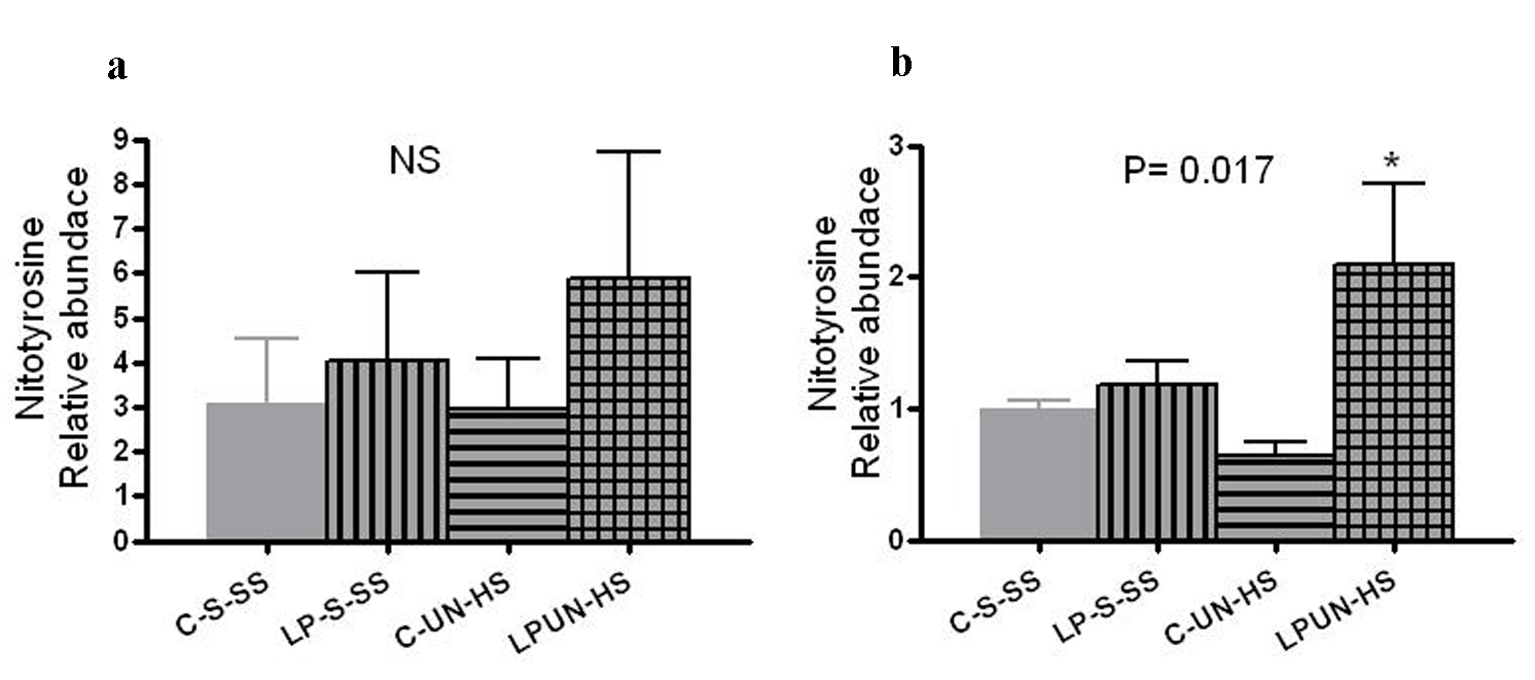
Figure 7. Kidney pathology at 6 months of age. Combined glomerular injury (a) and tubulointerstitial injury score (b) in control (C) and LP rats after exposure to high salt diet (HS) and unilateral nephrectomy (UN) vs. sham (S) surgery and on standard salt diet. (n = 6-9 in each group, *P < 0.05 vs. C-S-SS).
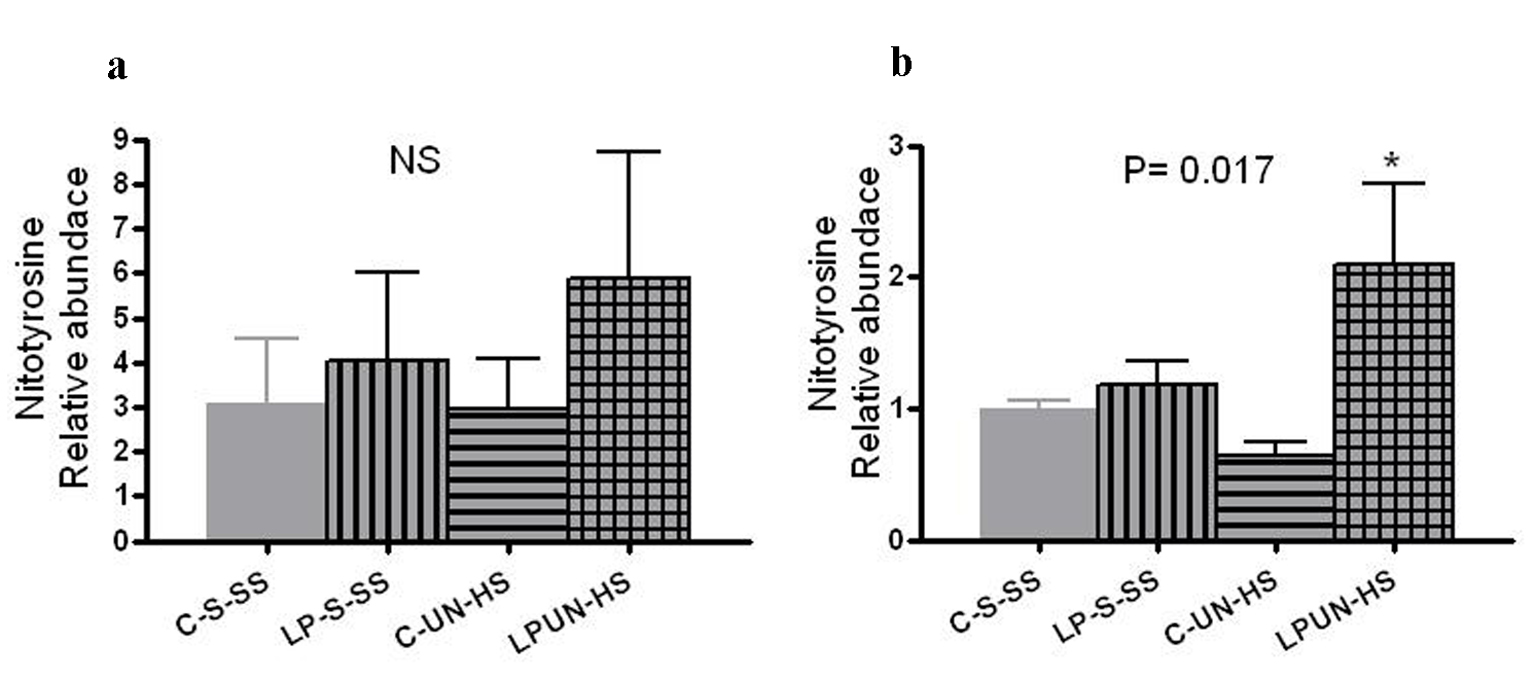
Figure 8. Renal nitrotyrosine content. Kidneys from (a) 8 weeks old offspring (n = 8 in each group) and in (b) 6 months old females (n = 5-7 in each group, *P < 0.05 vs. C-S-SS).
Table
Table 1. Kidney Pathology at 6 Months of Age
| Group | Focal sclerosis percentage | Global sclerosis percentage | Tubular atrophy score | Interstitial fibrosis score |
|---|
| Kidney injury scores (in both males and females) at 6 months of age. Data were presented as mean ± SEM (n = 7 in C-S-SS, 9 in LP-S-SS, 6 in C-UN-HS, and 7 in LP-UN-HS; analysis was performed by Fisher’s test). |
| C-S-SS | 0.6500 (0-5.2) | 0.0 (0-1.7) | 1.0 (1-2) | 1.330 (1-2) |
| LP-S-SS | 2.58 (0-6.6) | 1.76 (0-7.3) | 1.11 (1-2) | 1.44 (1-2) |
| C-UN-HS | 11.72 (0-22.9) | 16.4 (0-71.7) | 1.83 (1-3) | 2 (1-3) |
| LP-UN-HS | 14 (1.4-30.4) | 21.1 (0-69.6) | 2.22 (1-4) | 2.44 (1-4) |
| P value | 0.004* | 0.059 | 0.008* | 0.022* |


