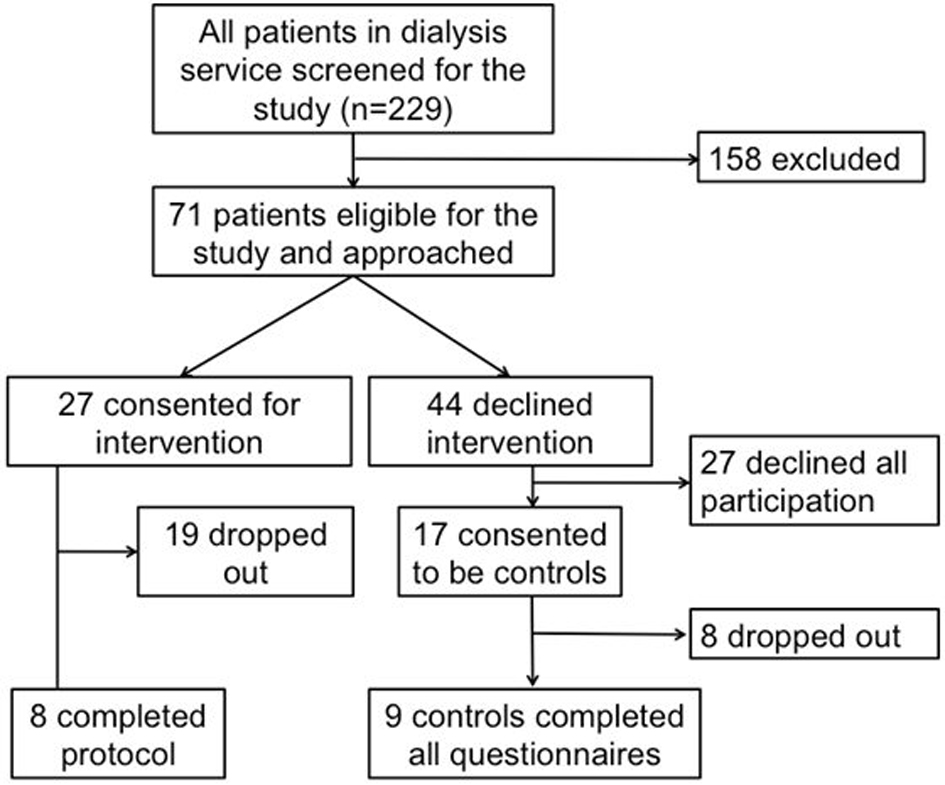
Figure 1. Flow diagram of patient recruitment and drop-out.
| World Journal of Nephrology and Urology, ISSN 1927-1239 print, 1927-1247 online, Open Access |
| Article copyright, the authors; Journal compilation copyright, World J Nephrol Urol and Elmer Press Inc |
| Journal website http://www.wjnu.org |
Original Article
Volume 3, Number 2, June 2014, pages 83-91
Psychological and Exercise Intervention Training for Hemodialysis Patients: A Pilot Study
Figures
Tables
| IC (n = 8) | ID (n = 19) | P value1 | CO (n = 17) | P value2 | |
|---|---|---|---|---|---|
| 1IC vs. CO; 2Intervention arm (IC and ID) vs. control arm (CO). Values (except nominal variables) are expressed in mean (SD). | |||||
| Age (years) | 64 (6) | 70 (11) | 0.268 | 67 (15) | 0.056 |
| Male gender | 7 (88%) | 11 (58%) | 0.149 | 9 (53%) | 0.276 |
| Dialysis vintage (months) | 39 (31) | 46 (35) | 0.714 | 50 (38) | 0.462 |
| Body mass index | 26 (3) | 27 (5) | 0.165 | 26 (5) | 0.853 |
| Diabetes, n (%) | 1 (13%) | 7 (37%) | 0.216 | 7 (41%) | 0.321 |
| Hypertension, n (%) | 6 (75%) | 16 (84%) | 0.472 | 14 (82%) | 0.635 |
| Myocardial infarct, n (%) | 0 | 3 (16%) | 0.331 | 3 (18%) | 0.426 |
| Peripheral vascular disease, n (%) | 0 | 4 (21%) | 0.221 | 2 (12%) | 0.574 |
| Cerebral vascular disease, n (%) | 1 (13%) | 1 (5%) | 0.513 | 3 (18%) | 0.285 |
| History of anxiety, n (%) | 0 | 1 (5%) | 0.704 | 0 | 0.614 |
| History of depression, n (%) | 0 | 2 (11%) | 0.487 | 3 (18%) | 0.285 |
| Systolic BP (mm Hg) | 137 (15) | 139 (14) | 0.447 | 143 (16) | 0.348 |
| Diastolic BP (mm Hg) | 76 (15) | 67 (14) | 0.877 | 70 (13) | 0.967 |
| Hb (g/L) | 114 (10) | 120 (10) | 0.856 | 115 (10) | 0.251 |
| Urea reduction ratio | 0.74 (0.04) | 0.75 (0.03) | 0.424 | 0.76 (0.05) | 0.956 |
| Serum albumin (g/L) | 37 (4) | 36 (3) | 0.433 | 35 (4) | 0.528 |
| Total protein (g/L) | 66 (4) | 67 (5) | 0.273 | 66 (5) | 0.651 |
| CRP (mg/L) | 8 (3) | 19 (7) | 0.074 | 5 (4) | 0.587 |
| Phosphate (mmol/L) | 1.69 (0.27) | 1.54 (0.38) | 0.384 | 1.57 (0.34) | 0.838 |
| PTH (pmol/L) | 27 (12) | 44 (26) | 0.053 | 39 (29) | 0.984 |
| IC (n = 8) | ID (n = 19) | P value | CO (n = 17) | P value | |
|---|---|---|---|---|---|
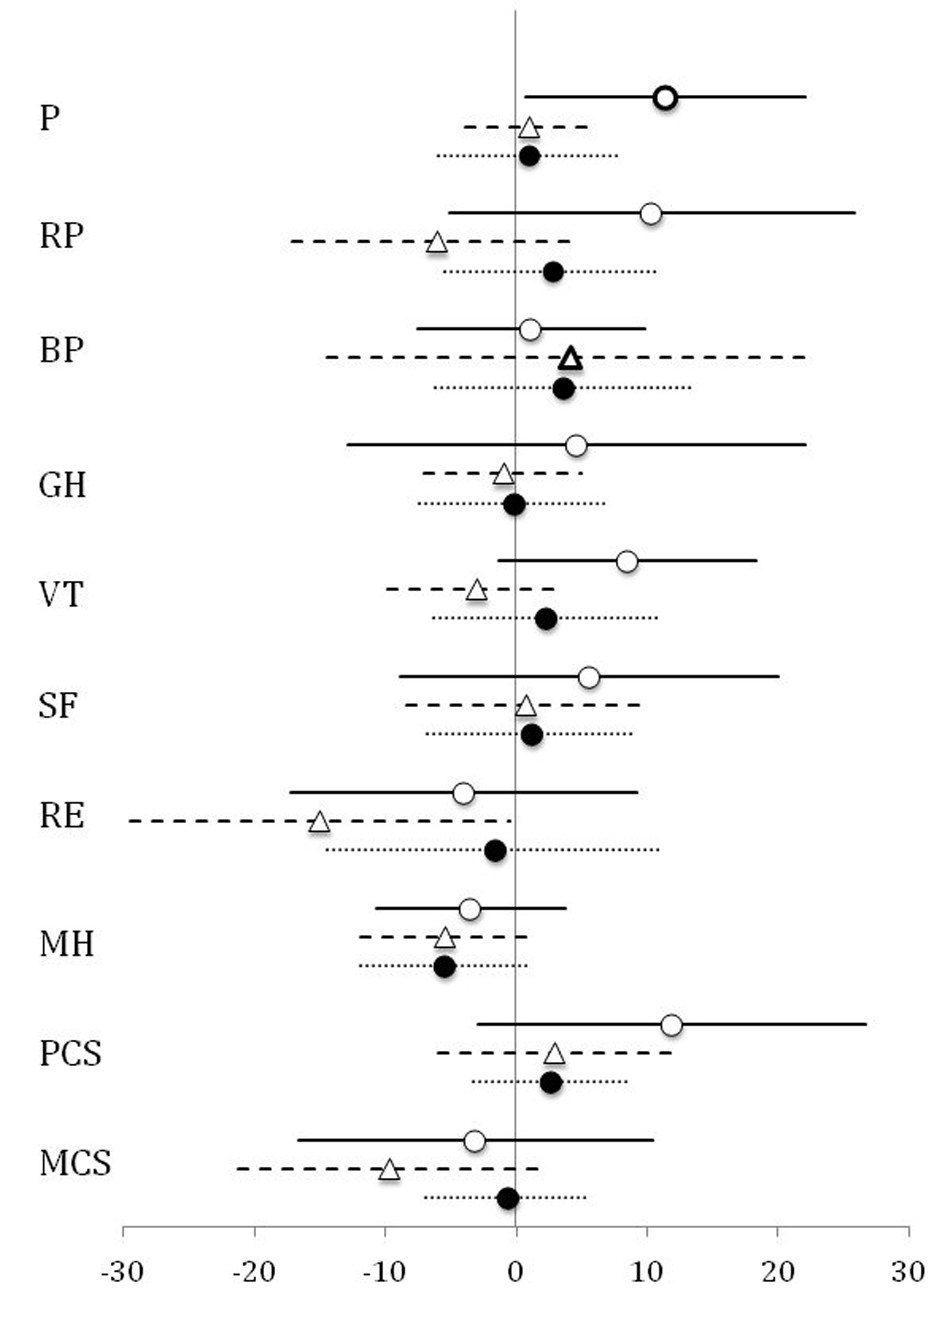
| PF: physical functioning; RP: role physical; BP: bodily pain; GH: general health; VT: vitality; SF: social functioning; RE: role emotional, PCS: physical composite summary; MCS: mental composite summary; CDS: cardiac depression scale; EES: exercise efficacy scale; *: for age-matched controls. All values are expressed in mean (SD). | |||||
| Health related quality of life | |||||
| SF-36 | |||||
| PF | 37 (12) | 33 (14) | 0.472 | 41 (11) | 0.167 |
| RP | 39 (13) | 37 (12) | 0.807 | 42 (11) | 0.289 |
| BP | 48 (14) | 35 (13) | 0.028 | 45 (12) | 0.238 |
| GH | 40 (13) | 38 (8) | 0.708 | 41 (10) | 0.556 |
| VT | 44 (11) | 44 (8) | 0.974 | 47 (11) | 0.280 |
| SF | 44 (10) | 39 (12) | 0.307 | 45 (12) | 0.300 |
| RE | 49 (9) | 34 (17) | 0.008 | 37 (14) | 0.961 |
| MH | 51 (8) | 42 (14) | 0.072 | 47 (10) | 0.671 |
| PCS | 38 (16) | 36 (12) | 0.747 | 42 (9) | 0.139 |
| MCS | 52 (9) | 42 (16) | 0.060 | 45 (10) | 0.962 |
| CDS | 79 (32) | 93 (30) | 0.299 | 81 (20) | 0.371 |
| EES | 121 (42) | 82 (28) | 0.019 | 97 (38) | 0.788 |
| Physical performance | |||||
| 6MWD (m) | 429 (75) | 334 (94) | 0.018 | - | - |
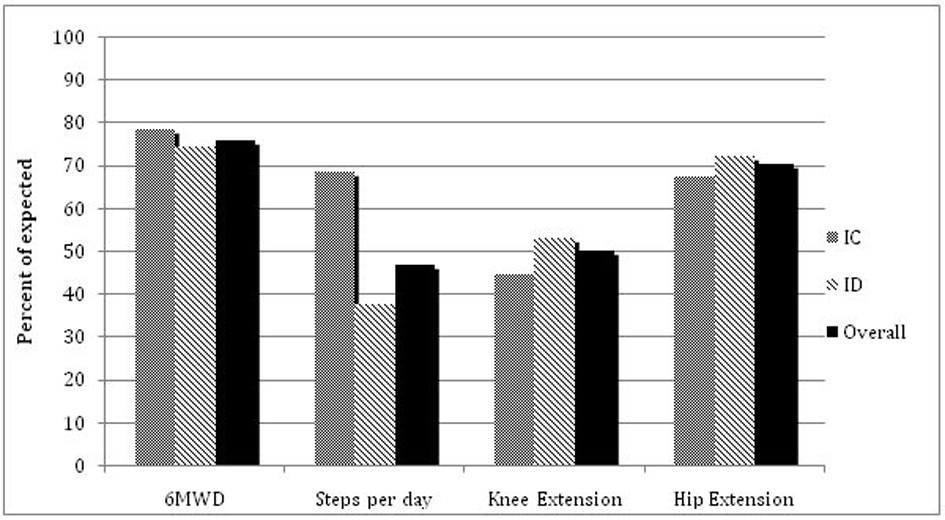
| % of predicted 6MWD* | 78 (12) | 74 (25) | 0.684 | - | - |
| Time spent recumbent (h) | 19 (3) | 21 (2) | 0.156 | - | - |
| Steps per day (× 1,000) | 6.8 (3.5) | 3.7 (2.4) | 0.063 | - | - |
| Muscle strength (kg) | |||||
| Chest press | 12 (5) | 12 (6) | 0.962 | - | - |
| Knee extension | 17 (5) | 16 (5) | 0.571 | - | - |
| Hip extension | 16 (3) | 15 (5) | 0.780 | - | - |
| Mean change (95% CI) | P value | |
|---|---|---|
| CDS | ||
| IC | -7.33 (-25.00 - 10.31) | 0.334 |
| ID | -2.38 (-16.75 - 12.00) | 0.708 |
| CO | 2.29 (-14.56 - 20.13) | 0.751 |
| EES | ||
| IC | 3.83 (-38.07 - 45.73) | 0.823 |
| ID | -18.38 (-64.26 - 27.51) | 0.375 |
| CO | 17.38 (-31.08 - 65.83) | 0.425 |
| 6MWD (m) | ||
| IC | 98 (24 - 172) | 0.018 |
| ID | -12 (-103 - 80) | 0.769 |
| Time spent recumbent (h) | ||
| IC | 0.15 (-0.86 - 1.16) | 0.730 |
| ID | 0.70 (-0.29 - 1.70) | 0.123 |
| Steps per day | ||
| IC | 193 (-2,009 - 2,395) | 0.857 |
| ID | -1,286 (-3,110 - 573) | 0.128 |
| Chest press strength (kg) | ||
| IC | 5.21 (0.15 - 10.27) | 0.045 |
| ID | 3.42 (-15.31 - 8.47) | 0.248 |
| Knee extension strength (kg) | ||
| IC | 2.50 (-3.20 - 8.22) | 0.324 |
| ID | -4.73 (-9.55 - 0.08) | 0.053 |
| Hip extension strength (kg) | ||
| IC | 1.33 (0.05 - 2.70) | 0.057 |
| ID | -1.49 (-5.30 - 2.31) | 0.300 |